
The CME/NYMEX WTI futures contract for delivery at Cushing, OK is the most liquid commodity futures contract in the world. The NYMEX crude price is so ubiquitous that it underpins most of the domestic U.S. crude spot market. In other words, spot deals for WTI and other crude grades tend to be priced in reference to NYMEX WTI. However, this linkage is not without complication, owing to the differences between futures and physical trading conventions as well as the delivery mechanism that links the futures and physical markets.
Futures transactions are based on the trading of standardized contracts for the purchase or sale of a standard quantity of an energy commodity on an organized exchange, with settlement to occur at some date in the future. Buyer and seller never know each other’s identity. In contrast, physical spot market trades are bilateral transactions between buyers and sellers of physical crude oil for short-term delivery timing. In practice spot delivery means anything up to a month away. Because traders want the most accurate value for their crude, they prefer to link their pricing to the heavily traded NYMEX futures market that is hard to manipulate and easy to hedge. Understanding spot crude pricing for WTI and other US domestic grades therefore requires an understanding of futures pricing and the differences between futures and physical crude markets.
In theory the terms and conditions for physical crude oil trades are entirely custom to each transaction. Traders can literally agree on any contractual provisions, including the price and/or pricing mechanisms. In practice, however, the majority of trades follow fairly standard terms that any two counterparties can feel comfortable with. Many crude transactions take place under long-term contracts that last for years, termed master service agreements. The bi-lateral master services agreement between buyer and seller defines the general conditions of the trade such as product specifications, credit terms and conditions, payment terms and other general provisions. These master services agreements underlie more specific agreements – which may be long term arrangements or spot deals, that specify the volumes to be transacted every month, delivery location, and pricing mechanism.
The pricing mechanism in these crude oil contracts contains several elements that normally include the following:
- NYMEX pricing element – a price that is related to prompt NYMEX crude oil at the time of delivery.
- Grade differential to the NYMEX price element – a premium or discount to NYMEX depending on the crude grade (if the crude is not WTI)
- Transport element reflecting any transportation cost to the pricing location – normally a pipeline and or trucking fee
- Custom price differential – discount or premium to the sum of the above elements negotiated by the participants in the transaction
The first three of these pricing elements reference daily prices during the delivery month (usually a calendar month) but are averaged to create a monthly invoice. The invoice cannot be finalized until after the delivery period when all the pricing elements are available.
Before we describe how NYMEX WTI futures are linked to pricing for physical crude deliveries we need to address a few basic concepts that will help the explanation.
NYMEX and physical crude oil delivery concepts
- For each futures commodity, the NYMEX lists a variable number of futures contracts that are available to trade. The number of contracts listed reflects trading interest in the commodity.
- Every NYMEX WTI futures contract in the list is for delivery during a particular calendar month in the future. The futures contract names like “December 2016” represents the calendar month when the crude will be delivered – the delivery period.
- Each futures contract has a lifespan that starts when it is first traded and ends when the contract expires. The contract expires a predetermined time before the delivery period starts.
- Most futures contracts are sold/bought back into the futures market before the contract expires – they are just financial transactions. A small percentage of contracts are held by participants to expiry and therefore go into delivery.
- A NYMEX WTI futures contract contains detailed instructions about delivery stating that it must occur at Cushing, OK into a pipeline or storage facility during the delivery period (see a copy of the specifications here).
- Any pipeline deliveries made in the US domestic crude oil market for a particular month have to be scheduled by the 25th day of the month prior to actual delivery (or the closest business day before the 25th).
- To give holders of NYMEX crude futures contracts for prompt delivery a chance to schedule their deliveries with a pipeline (if they decide to take delivery instead of closing out their futures position) the NYMEX prompt contracts expire 3 business days before scheduling ends.
- The April 2016 NYMEX crude futures contract will therefore expire 3 business days before the 25th of March. Thus the NYMEX April 2016 contract expires on Tuesday, March 22, 2016.
- Physical barrels of US domestic crude are traded based on the monthly pipeline schedule. That schedule runs from one pipeline schedule deadline to the next. Physical barrels for April 2016 delivery are traded in the physical market up until the scheduling deadline – March 25, 2016. April barrels will become “prompt” the day after February 25, 2016. The “trading month” for April barrels is therefore February 26, 2016 to March 25, 2016.
- Each NYMEX futures contract is for 1,000 Bbl of crude.
The NYMEX pricing element in physical crude contracts is determined using one of several formulas. The most common is the NYMEX CMA and in case you were wondering it has nothing to do with country music awards – it stands for calendar month average.
There are two parts to the CMA – a basic part and a more complicated “NYMEX Roll” mechanism. Some contracts use both parts and others forgo the NYMEX roll.
The “basic” CMA is simply the average of NYMEX close prices during the month when the physical crude is delivered. As an example, Table #1 below shows CMA values calculated for November 2015 delivery. The result is $42.92 per barrel. In this example, only the NYMEX trade days (called Merc days) are used in the average. A variation on the calculation is to fill in weekends and holidays with the previous trade day value. The CMA average is an accurate indication of WTI NYMEX pricing during the period when the physical crude is delivered (i.e. November 2015) but the futures pricing referenced is actually for crude to be delivered in the next two months. For example, in the table, November is the delivery period, but the prompt NYMEX prices in the CMA average are for the December futures contract between November 2nd and November 20th (when December futures expire) and for the January 2016 futures contract from November 23rd to November 30th (shaded green).
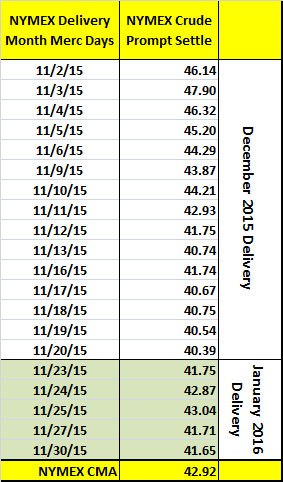
Table #1 – Basic CMA; November 2015 Delivery
The CMA therefore averages crude prices for future delivery during a current calendar month. It is this dichotomy between the apparently simple CMA price calculation and the delivery periods in the physical market that complicates the use of this average. If futures prices are going up in the future (known as contango) the buyer could argue that the price for November delivery should be lower. If futures prices are falling in the future (backwardation) then the seller could argue that the CMA price for November should be higher.
Resolving these price differences between forward and current futures price contracts is the purpose of the CMA NYMEX roll mechanism. It is called the “roll adjust” because it adjusts the basic CMA up or down based on whether the prices for November trades were higher or lower than the December 2015 and January 2016 contract prices averaged in the basic NYMEX CMA. Put another way, the adjustment represents the cost of rolling November futures positions into December or January positions.
The CMA Roll
The calculations for the CMA roll for the November contract are shown in Table #2. The first elements to calculate are the differences between the prices for November delivery futures during the last month that November traded before expiry and the prices for December (2nd month settle) and January (3rd month settle) during the same time period. To get those price spreads we first go back to the period when November was the prompt NYMEX futures contract – between September 21, 2015 and October 20, 2015 (see table below). We calculate the average of settle prices during that period for November, December and January 2016. These values are the trade month averages at the bottom of the table.
The last row in Table #2 calculates the spreads between the prompt month settle, the 2nd month settle (December) and the 3rd month settle (January). These values are $0.51 and $1.19, respectively.
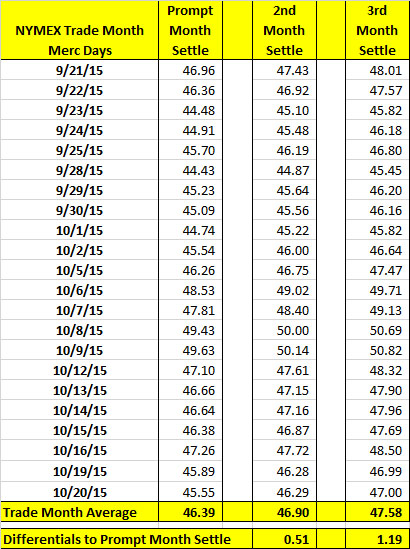
Table #2 – CMA Roll Daily Calculations
The next part of the calculation is shown in Table #3 below. At the top of the table (to the right) is the basic CMA NYMEX average calculated in Table #1 above ($42.92/bbl). In the second and third rows of column 2 are the spreads between the trade month averages (from the bottom row of our first table above) for November and December (row 2) and November and January (row 3). These two values are then weighted to reflect the amount of time during the November delivery period that December and January futures were prompt. During any delivery month, the WTI futures contract expires on or around the 20th of the month. In our case in November 2015 that means December was the prompt contract for about 20 days (including holidays and weekends) or 2/3 of the month and January was the prompt contract for about 10 days or 1/3 of the month.
In our roll adjust calculation the weighting we apply to the trade month average spreads are therefore two thirds (0.67) * Nov/Dec spread (= $-0.51/Bbl) and one third (0.33) * Nov/Jan spread (= $-1.19/Bbl) and these values show up in the table below in the left column. Note that we subtract the weighted spread values. This is because if the actual spread were positive (as it is in this case) then future prices are higher (contango) so the roll adjust is a discount and if future prices were lower (backwardation) the spread would be negative and the roll adjust would be a premium (double negative). Finally, the two weighted adjust values are added to the basic CMA average to arrive at the NYMEX CMA Roll Adjusted value of $42.19/Bbl for November 2015.
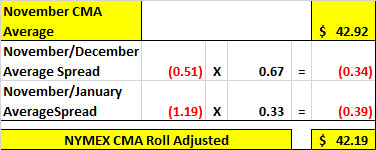
Table #3 – CMA Roll Month Calculations
The roll adjust calculation has variations based on different weighting methods for the two roll spreads. Our version used a simple 2/3 and 1/3 ratio but it is also possible to count the actual number of Merc days in the delivery period (in our case) for December and January delivery and use a precise weighting for each delivery period based on the actual ratio of days. The latter is more complicated to calculate.
That is the CMA Roll Adjust mechanism. The NYMEX CMA and CMA Roll may then be further adjusted to reflect crude location, crude grade differences and a negotiated differential. CMA averages show up in crude contracts for nearly all US domestic crudes.